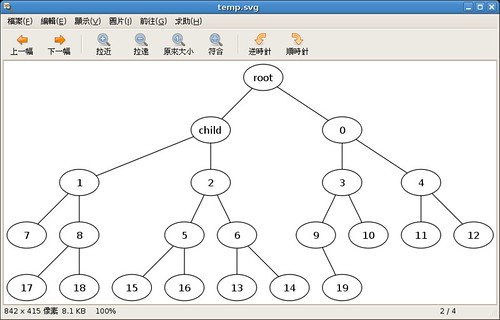
最近正在實作 BATON 的演算法,當仁不讓的還是使用 Python 來解決這個問題。以下是我要實作演算法的虛擬碼:
Algorithm: join(node n)
If (Full(LeftRoutingTable(n)) and
Full(RightRoutingTable(n)) and
((LeftChild(n)==null) or (RightChild(n)==null))
Accept new node as child of n
Else
If ((Not Full(LeftRoutingTable(n))) or
  (Not Full(RightRoutingTable(n))))
 Forward the JOIN request to parent(n)
Else
 m=SomeNodesNotHavingEnoughChildrenIn
      (LeftRoutingTable(n), RightRoutingTable(n))
 If (there exists such an m)
    Forward the JOIN request to m
 Else
    Forward the JOIN request to one of its
    adjacent nodes
 End If
End If
End If
def join(child, n):
if Full(n['LeftRoutingTable']) and \
Full(n['RightRoutingTable']) and \
((n['LeftChild'] == None) or (n['RightChild'] == None)):
 print '    ' + str(n['Name']) + ' -- ' + str(child['Name']) + ';'
 accept(child, n)
else:
 if not Full(n['LeftRoutingTable']) or not Full(n['RightRoutingTable']):
     join(child, n['Parent'])
 else:
     m = NodesNotEnoughChildren(n['LeftRoutingTable'], n['RightRoutingTable'])
     if(m != None):
         join(child, m)
     else:
         # Forward the JOIN request to one ofits adjacent nodes
         if n['LeftAdjacent'] != None:
             join(child, n['LeftAdjacent'])
         else:
             join(child, n['RightAdjacent'])
是不是與虛擬碼非常相似呢?撰寫完演算法後,還有一個工作就是要視覺化的表達樹的結構。正巧這幾個禮拜在紅塵一隅間拾得的文章裡面提到了 graphviz 這個非常好用的工具,可以用來產生各種有向、無向圖形。所以就利用這個工具來產生圖形,而 Python 呼叫外部程式當然也是很簡單:
def node(name):
return {
    'Parent' : None,
    'LeftChild' : None,
    'RightChild' : None,
    'LeftRoutingTable' : list(),
    'RightRoutingTable' : list(),
    'LeftAdjacent' : None,
    'RightAdjacent' : None,
    'Name' : name,
    'Level' : 0
}

def travel(node, tstr):
if node['LeftChild'] != None:
    tstr += '    ' + str(node['Name']) + ' -- ' + str(node['LeftChild']['Name']) + ';\n'
    tstr = travel(node['LeftChild'], tstr)
if node['RightChild'] != None:
    tstr += '    ' + str(node['Name']) + ' -- ' + str(node['RightChild']['Name']) + ';\n'
    tstr = travel(node['RightChild'], tstr)
return tstr

root = node('root')
child = node('child')
join(child, root)

for i in range(0, int(sys.argv[1])):
c = node(i)
join(c, root)
print 'Finish\n'

tstr = travel(root, '')

temp = Template('graph G{\n$info\n}\n')
s = temp.substitute(info=tstr)

file = open('temp.dot', 'w')
file.write(s)
file.close()

os.system('dot -Tsvg -o temp.svg temp.dot')
os.system('eog temp.svg')

Python 是個好東西阿!
沒有留言 :
張貼留言